Statistics and data analysis make up a solid chunk of SAT Math questions, and many students find this section less intuitive than algebra. The good news is that the SAT never asks you to do complicated calculations here. Instead, it tests whether you understand what the data actually means.
This article walks through every topic you need to know, from reading two-way tables to interpreting scatterplots, so you can approach these questions with confidence instead of guessing.
What Are SAT Math Questions on Statistics & Data Analysis?
Watch this quick concept video to understand SAT Math Statistics & Data Analysis questions before working through the examples and practice questions below.
Two-Way Tables and Conditional Probability
A two-way table organizes data by two categories at once, like gender and favorite subject, or grade level and pass or fail. Rows represent one category and columns represent another, with each cell showing the count for that combination.
1. Reading the table
Start by identifying what each row and column represents. The numbers inside the grid are counts, and the numbers along the outer edges are totals for each category.
2. Marginal totals
Marginal totals are the row and column sums found along the edges of the table. The bottom right cell is the grand total, which represents everyone or everything in the dataset.
3. Conditional probability from tables
Conditional probability asks for the probability of an event given that another condition is already true. When you see the word given in a question, you are working with conditional probability.
Example
In a survey, 40 students prefer math and 25 of them are freshmen. If a student is chosen at random from those who prefer math, what is the probability they are a freshman?
Here you only look within the math preferring group, not the entire table. The answer is 25/40, which simplifies to 5/8. The key trick is that conditional probability restricts your denominator to just the given condition, not the whole dataset.
4. Scatterplots and the line of best fit
A scatterplot shows the relationship between two variables using individual data points. The SAT often draws a line of best fit through the data and asks you to interpret it.
The line follows the standard form y = mx + b, where m is the slope and b is the y-intercept. You will rarely need to calculate this line from scratch. Instead, the SAT wants you to read the equation and explain what it means in real terms.
5. Interpreting slope in context
The slope tells you how much the dependent variable changes for every one unit increase in the independent variable. If a scatterplot compares hours studied to test scores and the slope is 4, then each additional hour of studying is associated with a 4 point increase in test score.
6. Interpreting the y-intercept in context
The y-intercept represents the predicted value when the independent variable equals zero. In the studying example, the y-intercept would represent the predicted test score for a student who studied zero hours.
Always connect the slope and y-intercept back to the actual scenario in the question. The SAT rewards students who can explain numbers in plain language, not just calculate them.
Mean vs Median and Why Skewed Data Matters
Mean and median both describe the center of a dataset, but they behave differently depending on the shape of the data.
Mean is the sum of all values divided by the count. It uses every single value in the dataset, which means extreme values pull it in their direction.
Median is the middle value when the data is ordered. It only cares about position, not magnitude, so extreme values do not affect it as strongly.
1. Why they differ when data is skewed
When a dataset has outliers or is skewed, the mean shifts toward the tail while the median stays closer to the bulk of the data. For example, if most house prices in a neighborhood are between 200,000 and 300,000 dollars but one house sells for 2 million dollars, the mean will be pulled way up, but the median will still reflect a typical home price.
This is why the SAT often asks which measure better represents the data, especially with skewed distributions. The answer is almost always median when outliers are present, because it is not affected by extreme values.
2. Standard deviation concepts
Standard deviation measures how spread out the data is from the mean. A small standard deviation means the values are clustered close together, while a large standard deviation means the values are more spread out.
Here is good news. The SAT never asks you to calculate standard deviation by hand. You only need to interpret it and compare it between datasets.
For example, if you see two dot plots and one looks more spread out while the other is tightly bunched near the center, the spread out dataset has the larger standard deviation. You can answer these questions just by looking at the shape of the data.
Probability Rules on the SAT
1. Single event probability
Probability of a single event equals favorable outcomes divided by total outcomes. If a jar has 4 green candies and 6 red candies, the probability of picking green is 4/10, which simplifies to 2/5.
2. The and rule
When you need two independent events to both happen, multiply their probabilities. If the probability of rain tomorrow is 0.3 and the probability of a traffic jam is 0.5, the probability of both happening is 0.3 times 0.5, which equals 0.15.
3. The or rule
When you need either one event or another to happen, add their probabilities. If the events overlap, subtract the probability of both happening to avoid counting it twice. This is written as P(A or B) = P(A) + P(B) minus P(A and B).
4. Expected value basics
Expected value is the average outcome you would predict over many trials. You calculate it by multiplying each possible outcome by its probability and adding the results together.
For example, if a raffle ticket has a 1 in 100 chance of winning 500 dollars and otherwise wins nothing, the expected value is (1/100) times 500, which equals 5 dollars. This does not mean you will win 5 dollars. It means that over many tickets, the average payout per ticket approaches 5 dollars.
Surveys, Sampling, and Bias
The SAT tests whether you understand how surveys work and when their results can be trusted.
1. Understanding bias
Bias happens when a sample does not accurately represent the larger population. If you survey only students in an advanced math class about their favorite subject, the results will not reflect the opinions of the entire school.
2. Margin of error
Margin of error describes how much the sample results might differ from the true population value. A smaller margin of error means more precision, and it usually comes from a larger, well chosen sample size.
3. Making inferences to populations
You can only generalize survey results to a population if the sample was random and representative. If a survey used a random sample of the entire student body, you can reasonably infer that the results apply to all students at that school. If the sample was biased or too small, you cannot make that same inference with confidence.
SAT Data Analysis Practice Problems
Work through these SAT Math questions on your own first, then check your reasoning against the solutions.
Problem 1 (Target Time: 50 seconds)
In a survey of 60 students, 35 prefer science and 25 prefer history. Of the students who prefer science, 20 are sophomores. If a student is picked at random from those who prefer science, what is the probability they are a sophomore?
Solution
This is conditional probability, so the denominator is only the science group, not all 60 students. The probability is 20/35, which simplifies to 4/7.
Answer is 4/7
Problem 2 (Target Time: 45 seconds)
A scatterplot shows the relationship between weeks of practice and typing speed, with a line of best fit given by y = 2.5x + 30. What does the slope represent in this context?
Solution
The slope represents the rate of change between the two variables. For every additional week of practice, typing speed increases by 2.5 words per minute.
Answer is typing speed increases by 2.5 words per minute for each additional week of practice.
Problem 3 (Target Time: 55 seconds)
A dataset of home prices in a neighborhood is heavily skewed because of one extremely expensive mansion. Which measure of central tendency better represents a typical home price in this neighborhood, and why?
Solution
Median is the better measure because it is not affected by extreme outliers. The mansion would pull the mean far higher than what most homes actually cost, but the median stays close to the typical value in the dataset.
Answer is median, because it resists the pull of outliers.
SAT Math Questions with Video Solutions
Try these harder questions on your own before checking the solutions. These reflect the upper difficulty level you might see on test day.
Question 1
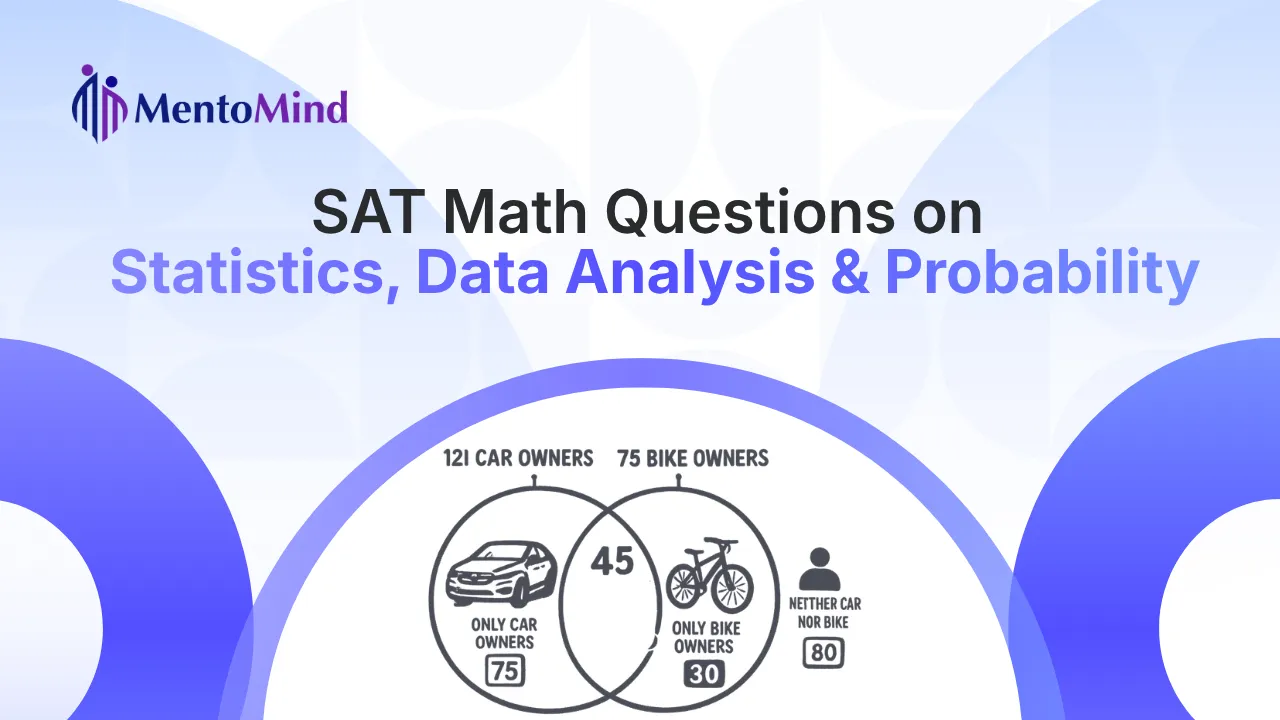
A survey asked 200 people whether they own a car and whether they own a bike. Of the 120 people who own a car, 45 also own a bike. Of the 80 people who do not own a car, 30 own a bike. If a person is selected at random from those who own a bike, what is the probability they also own a car?
A. 45/200 B. 45/75 C. 45/120 D. 75/200
Solution
First find the total number of bike owners. There are 45 car owners who also own a bike, plus 30 non car owners who own a bike, giving a total of 45 plus 30, which equals 75 bike owners.
The question asks for the probability of owning a car given that the person owns a bike, so the denominator must be the bike owning group, which is 75.
The probability is 45/75.
Final Answer: B
Key rule
Conditional probability questions restrict the denominator to the given condition. Always identify what group you are choosing from before dividing.
Why the other choices are wrong
A (45/200) uses the entire survey as the denominator instead of just bike owners. C (45/120) uses car owners as the denominator, which answers a different question. D (75/200) calculates the probability of owning a bike out of everyone surveyed, not the conditional probability being asked.
Think10x.ai Video Explaining a Conditional Probability Problem (Step-by-Step)
Question 2
A carnival game costs 4 dollars to play. There is a 1/10 chance of winning 30 dollars, a 1/5 chance of winning 10 dollars, and otherwise the player wins nothing. What is the expected net gain or loss per game?
A. Gain of 1 dollar B. Loss of 1 dollar C. Loss of 2 dollars D. Break even, 0 dollars
Solution
First calculate the expected winnings. Multiply each prize by its probability and add the results.
(1/10) times 30 equals 3. (1/5) times 10 equals 2. The probability of winning nothing is 1 minus 1/10 minus 1/5, which equals 7/10, and that contributes 0 dollars.
Expected winnings equal 3 plus 2 plus 0, which is 5 dollars.
Since the game costs 4 dollars to play, the expected net gain is 5 minus 4, which equals 1 dollar.
Final Answer: A
Key rule
Expected value equals the sum of each outcome multiplied by its probability. When a cost is involved, subtract that cost from the expected winnings to find the net expected value.
Why the other choices are wrong
B (loss of 1 dollar) and C (loss of 2 dollars) likely come from forgetting to subtract the entry cost correctly or misreading the sign. D (break even) would only be correct if expected winnings equaled exactly 4 dollars, but the calculation shows 5 dollars.
Think10x.ai Video Explaining an Expected Value Problem (Net Gain and Loss)
Frequently Asked Questions
The SAT covers two-way tables, conditional probability, scatterplots and lines of best fit, mean versus median, standard deviation concepts, probability rules including AND and OR, expected value, and survey sampling with bias and margin of error. These SAT Math questions on statistics typically appear 6 to 8 times across the Math section.
No. The SAT only tests whether you can interpret standard deviation and compare spread between datasets. You will never need to compute it by hand, so focus on understanding what a larger or smaller spread means visually.
Use median when the data has outliers or is skewed, since it is not affected by extreme values. Use mean when the data is fairly symmetric without major outliers. The SAT often signals skewed data by describing one unusually high or low value in the scenario.
The AND rule multiplies probabilities when you need both events to happen. The OR rule adds probabilities when you need either event to happen, and you subtract any overlap so you do not count it twice. Reading the question carefully tells you which rule applies.
A biased sample does not represent the full population, so any conclusions drawn from it cannot be safely applied to everyone. The SAT tests this by describing a survey method and asking whether the results can be generalized. If the sample was not random or was too narrow, the answer is usually that you cannot make that inference.
Want a Step-by-Step Video Explanation For Your Own SAT Math Question?
The video explanations above were created using Think10x.ai.
Upload a clear photo of any math problem, including probability, algebra, geometry, or calculus, and our tool will turn it into a narrated, animated explanation in minutes.
👉 Try it at Think10x.ai